
TL;DR
Private residential construction spending increased 1.1% in August 2026 from July, reaching a seasonally adjusted annual rate of $882.3 billion, according to the U.S. Census Bureau. Spending remained 4.8% below August 2025; all residential categories rose month to month, while remodeling recorded the largest monthly gain.
U.S. private residential construction spending rose 1.1% in August from July to a seasonally adjusted annual rate of $882.3 billion, according to the U.S. Census Bureau. The increase followed months of declines during the second quarter, but spending was still 4.8% lower than in August 2025, according to an analysis by the National Association of Home Builders.

Get business pricing on tools and workshop supplies
- Business-only prices and quantity discounts
- Tax-exempt purchasing
- Multiple users, one account, clear invoices
Each of the three residential categories cited in the report recorded a monthly increase. Spending on improvements, including remodeling, had the largest gain, rising 2.5% in August. Despite that monthly rise, improvement spending was down 7.4% year over year.
Single-family construction spending increased 0.2% from July, while multifamily construction spending also rose 0.2%. Compared with August 2025, single-family spending was down 3.5% and multifamily spending was down 0.6%, the figures cited in the NAHB analysis show.
The August figures describe the value of private residential construction put in place, expressed at a seasonally adjusted annual rate. The annual-rate figure is not the amount spent during August alone. The release provides monthly and annual comparisons, but does not identify a dollar amount for each category in the supplied material.
August Rebound Still Trails Last Year
The monthly increase offers a change in direction after declines during the second quarter, but the year-over-year drop shows that the residential construction spending measure has not returned to its level a year earlier. For readers tracking housing activity, the two comparisons tell different parts of the story: spending rose from July, while the annual comparison remained negative.
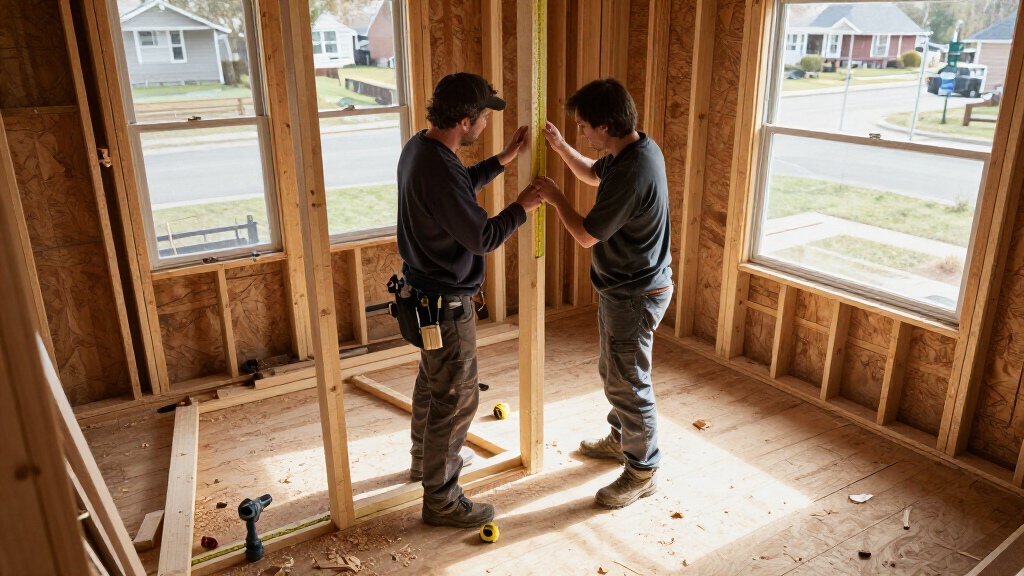
The category breakdown also matters to businesses connected to homebuilding and home improvement. Remodeling posted the strongest monthly gain, which may be relevant to contractors and suppliers, while both single-family and multifamily construction recorded smaller increases. The reported figures measure spending, however; they do not by themselves establish how many homes were started or completed, or explain the prospects of individual builders and retailers.
The NAHB analysis attributes the annual declines in single-family and multifamily construction largely to weak builder sentiment amid rising interest rates and costs. That is the association’s explanation of the pattern, not a separate finding in the Census Bureau spending figures. The August release also does not show whether the monthly gains will persist.
Products Worth Considering

Ring Alarm 8-Piece Kit (Newest Model) – Home Security System

Ring Alarm 14-Piece Kit

Philips Hue Bridge Pro Starter Kit with 4 A19 E26 Color Smart Bulbs
As an affiliate, we earn on qualifying purchases.
Three Sectors, Different Annual Trends
The Census Bureau data, as summarized in an analysis from the National Association of Home Builders, show a monthly improvement after several months of decline during the second quarter of 2026. August’s 1.1% increase applies to total private residential construction spending compared with July; the 4.8% decline compares August 2026 with August 2025.
The categories moved by different amounts over those periods. Remodeling had the largest monthly increase but the steepest reported year-over-year decline, at 7.4%. Single-family spending rose slightly month to month and was 3.5% lower over the year, while multifamily spending also rose slightly monthly and was 0.6% lower annually. These differences caution against treating the overall monthly rise as evidence that every part of residential construction is recovering at the same pace.
The NAHB analysis says improvement spending had been on an upward trend since 2023, supported in part by an aging housing stock and sustained renovation demand. It characterizes the latest data as consistent with a soft patch for remodeling in 2026. That description is the association’s interpretation; the supplied report does not include a longer set of monthly figures or a forecast to quantify how long the slowdown may last.
“Private residential construction spending was reported at a seasonally adjusted annual rate of $882.3 billion in August.”
— U.S. Census Bureau figures cited in the report
How Long Will Gains Hold?
The reported data establish that spending rose in August from July, but do not show whether that increase continued in subsequent months. The supplied material also does not provide September figures, category-level dollar totals, or details that would show which types of projects drove the monthly changes.
The association’s account links annual declines in single-family and multifamily spending to builder sentiment, interest rates and costs, but it does not quantify how much each factor contributed. It is also unclear from this report whether the August remodeling gain signals a lasting change or a temporary monthly improvement. Further data are needed to assess the trend.
Watch for the Next Census Release
The next relevant milestone is the Census Bureau’s release of subsequent construction spending data, which can show whether August’s increase was sustained or reversed. Those figures will add evidence about the direction of total residential spending and the separate trends in improvements, single-family construction and multifamily construction.
Until then, August provides a single monthly gain against a negative year-over-year comparison. Readers should distinguish the seasonally adjusted annual-rate estimate from actual monthly outlays and avoid treating the rise as confirmation of a broader recovery.
Key Questions
How much did private residential construction spending rise in August?
It increased 1.1% from July, reaching a seasonally adjusted annual rate of $882.3 billion, according to Census Bureau figures cited in the report.
Was spending higher than it was a year earlier?
No. Total private residential construction spending was 4.8% below August 2025, despite the monthly increase.
Which category had the largest monthly gain?
Improvement spending, including remodeling, rose 2.5% from July, the largest monthly increase among the residential categories listed. It was still down 7.4% year over year.
Did single-family and multifamily construction spending increase?
Both rose 0.2% from July. Compared with August 2025, single-family spending was down 3.5%, and multifamily spending was down 0.6%.
Does the $882.3 billion figure represent spending during August alone?
No. It is a seasonally adjusted annual rate, which expresses the August pace on an annualized basis rather than the amount spent in that month alone.
Source: rss